Related Products
Literacy Instruction for Students who are Deaf and Hard of Hearing
$67.00
FLE – Recorded Functional Listening Evaluation Using Sentences
$18.00 – $99.00
Evidence-Based Practice in Educating Deaf and Hard-of-Hearing Students
$46.00For Professionals
- Amplification
- Assessment of Student Skills, Challenges, Needs
- Early Childhood: Infants, Toddlers, Preschool
- Hearing Loss – Identification, Impact and Next Steps
- IDEA Law Summary Information
- Language and Speech Development Issues
- Legal Issues in Serving Children with Hearing Loss
- Listening (Auditory Skills) Development
- Planning to Meet Student Needs
- Self-Advocacy Skills for Students with Hearing Loss
- Self-Concept: How the Child with Hearing Loss Sees Himself
- Social Skills
- Speech Perception & Learning
Related Teacher Tools Takeout Items
Speech Perception & Learning
- Brain Development & Hearing Loss
- Relationship of Hearing Loss to Listening and Learning
- Classroom Acoustics – Impact on Listening and Learning
- Classroom Acoustics – Design Requirements for Schools
- Understanding your Student’s Aided Hearing Using the Desired Sensation Level (DSL) Approach
Most students are hard of hearing, mainstreamed into typical classrooms (U.S.)

It is likely that the majority of the 80% in schools with less than 3 students with hearing loss are primarily auditory rather than primarily visual learners.
How can we estimate a student’s ability to access verbal instruction ?
CLEARLY UNDERSTAND THE STUDENT’S PERCEPTION OF SPEECH
The Familiar Sounds Audiogram is a tool that is often used to explain the audiogram in terms of what sounds a

person with hearing loss can and cannot hear. Although convenient, this tool lacks accuracy in depicting the different frequency elements that make up the different sounds of speech in the English language.
Speech Perception – Formant representations for Vowels and Consonants provides a one-page chart displaying the frequency spectrum of most vowels and consonants appearing in English. The
Speech Spectrum Audiogram for Consonants plots the formant information in a familiar audiogram form. When considering the impact of a child’s areas of hearing loss (hearing worse than 20 dB) on speech perception it is possible to review these charts to identify the speech sounds that are most likely to be confused by the child.

The handout
Ling Sounds & Formant Spectrum is also available to further understand how a child is perceiving speech sounds. This
information can contribute to ‘diagnosing’ when a speech perception issue is occurring and the specific frequency range at issue. The information about changes or lack of response at specific frequencies can be shared with the audiologist as a way to explore if amplification in specific frequency regions can be improved.
Another good resource on speech acoustics.
A resource for phonemic inventories across languages can be found here.
CONSIDER AUDIBILITY OF SPEECH
We often consider a child’s audiogram to understand how well they are able to detect sounds across the pitch range. Similar to understanding how well the student is able to perceive speech sounds in the different formant or frequency ranges, it is also helpful to more globally consider how much speech energy they are likely to perceive. Speech energy that is received can be interpreted as audibility, which can be considered as the opportunity a student has to perceive speech. Consider typically hearing students as having almost all of the pieces of a 100-piece picture puzzle. They can easily interpret and understand the picture. Now consider the child with hearing loss as having the same picture puzzle, but missing a number of pieces. Although the picture is the same, they don’t have the same opportunity to understand and interpret the picture because parts are missing. Now think about speech in the classroom as a dynamic puzzle in which pieces are missing due to hearing ability that causes parts of speech to be missed, and is made worse by background noise and excessive reverberation.
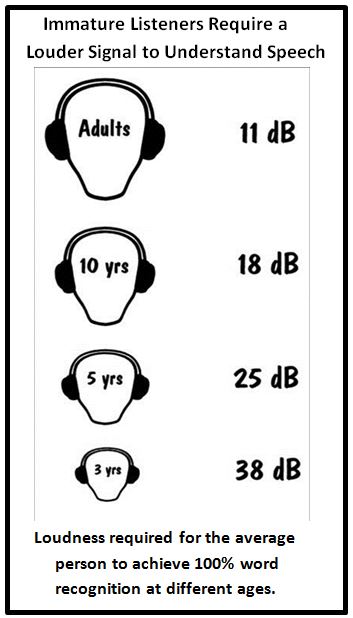
The

Speech Audibility Audiogram for Classroom Listening represents speech audibility for 35 dB HL (soft speech) and 50 dB HL (louder than conversational level speech) inputs and is based on the figure shown right. The Speech Audibility Audiogram for Classroom Listening has
a fillable form that allows you to input student information and your Functional Listening Evaluation results, and comments. You can also download a
of the Speech Audibility Audiogram for Classroom Listening rather than the fillable form if you prefer. You still need to record an individual’s average hearing level (with or without amplification). Note: Audibility and speech perception (word recognition) are not the same. A child may be able to perform well on single—word speech understanding tasks even if audibility is significantly decreased. Read this article for more information:
Predicting Speech Audibility from the Audiogram to Advocate for Listening and Learning Needs
Hearing Review, September 2011
ARTICLE:
Speech Perception in Classroom Acoustics by Children with Cochlear Implants. A J Audiol, 25(2) (2016). F. Iglehart.
DETERMINE THE PRECISION OF THE STUDENT’S LISTENING ABILITY

The Ling Sounds and standard word discrimination testing in a sound booth do not provide specific information on how a child perceives each consonant Each consonant is an es
 sential element for understanding speech clearly. A child who does not perceive all of the consonant sounds clearly will have increased difficulty comprehending speech.
Children demonstrating consonant perception errors need to have their hearing technology settings changed.
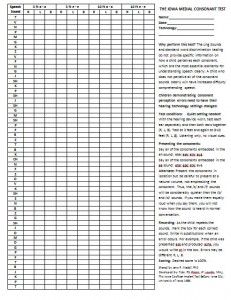
Ling Sounds are Not Enough! Administer the
Iowa Medial Consonant Test. In a quiet setting with the right, left and both hearing devices, have the child repeat when you say each consonant at 3 feet and 10 feet using a-a (e.g., awpaw) and/or e-e (e.g., eemee). Record the results on the
The Iowa Medial Consonant Test
. This test has been formatted and included for your use. Children with well fit hearing instruments should be able to achieve 100%.
CONSIDER FUNCTIONAL LISTENING ABILITY
The Functional Listening Evaluation (FLE) is a ‘staple’ of audiologists working with school-age children (C.D.

Johnson & P. Von Almen, 1993; Revised 2009 by C.D. Johnson). Age-appropriate speech stimuli are used (words, phrases, nonsense phrases) that the child must repeat back. Lists of words/phrases are presented in different conditions to develop a profile that estimates a student’s ability to access classroom communication.
The pressing question that many educators have when presented with a student’s FLE results is “How does his performance compare to his class peers without hearing loss?” This question can be addressed by research (
Speech in Noise Norms for Typical Children) that was performed in 1999 (Bodkin, Madell & Rosenfeld) with 126 typically h
![]()
earing children ages 3-17 years. These children were presented with age-appropriate lists of single words and asked to repeat the words in both quiet and competing noise 4 talker babble) using soft speech and louder than conversational level speech, which can be compared to listening to a teacher. The results were surprising. In quiet (35 and 50 dB HL), regardless of age, students scored at 95-98%. In a typical level of background noise (+5 dB S/N) with speech loudness comparable to a teacher from a distance (50 dB HL) children ages 3-17 scored just a bit lower – 93-97%. Even in VERY noisy conditions (0 dB S/N) to soft speech (i.e., student answering from across the classroom) these children were able to perform at 90-92% correct. For a student with hearing loss to “compete” with typically hearing peers, he or she would need to be able to have functional listening scores in the 90+% range.
Because the FLE requires a child to respond while only listening and also while watching the speaker’s face, we are also able to provide an estimate of just how beneficial to understanding it is for a student to watch the face of the teacher and class peers. This is especially relevant for students who are expected to take notes during teacher lectures or who have teachers who do not use peer names when calling on them to answer.
Visual Analogies for speech perception challenges when listening in a classroom.
Explaining the effects of reverberation and background noise can be challenging. These visual representations help the teacher or other individual to recognize the challenge posed by poor acoustics and communicates how this issue can result in reduced pace of learning. Also a puzzle analogy is also included to represent speech audibility and speech perception.
Critical Listening Distance for Self-Advocacy
handout
Performance and the Listening Bubble?
handout
DETERMINE FUNCTIONAL USE OF WHAT IS HEARD – LISTENING COMPREHENSION/LANGUAGE PROCESSING
Refer to information on the
Listening Comprehension Test 2 the
Listening Comprehension Test Adolescent and the
Test of Auditory Processing Skills and the
Phonological Awareness Test for detail on how a student’s precision listening and comprehension of what is heard in the classroom can be compared to age/grade peers.
ESTIMATING ACCESS TO VERBAL INSTRUCTION USING STUDENT INPUT
Estimating how a student is able to perceive speech in a school setting
provides very valuable information about his or her access to verbal instruction and classroom communication. Consider audibility, via the Speech Audibility Audiogram, results of a Functional Listening Evaluation and challenging listening situations identified via the
Listening Instrument For Education – Revised, as all are critical for planning of student accommodation and support needs. Refer to
Providing Audiology Services to School Children – More than Just Preferential Seating (The Hearing Journal, March 2012) for more information.
Generated report page from the e-version of the Listening Inventory For Education-Revised.

One issue we do not effectively address as we estimate access to classroom communication is the amount of extra effort the student with hearing loss must expend to perceive speech. Each extra millisecond it takes to process speech reduces the cognitive resources available for the student to take what is heard and comprehend the meaning. This requires substantial extra effort that contributes to greater fatigue in the student with hearing loss. These factors underscore the need for extra repetition of new vocabulary and concepts in the classroom and more opportunities to be exposed to this information prior to its introduction to the class. Listening and learning with a hearing loss can be hard work, and challenging to keep pace with the rest of the class.
References:
- Mitchell R., & Karchmer, M. (2006). Demographics of deaf education: More students in more places. American Annals of the Deaf, 151(2), 95-104.
- Anderson, K.L. (2012). Speech Spectrum Audiogram for Consonants.Based on the work of Ross, M., Brackett, D., & Maxon, A.B (1991). Assessment and management of mainstreamed hearing-impaired children: Principles and practices. Pg 190. Austin, TX: Pro-Ed.
-
Advanced Bionics (2009). The Sounds of Speech. Adapted from Ling, Daniel (1976) Speech and the Hearing Impaired Child: Theory and Practice
http://www.advancedbionics.com/content/dam/ab/Global/en_ce/documents/libraries/AssessmentTools/3-01066-B-6_Sounds%20of%20Speech-FNL.pdf - Anderson, K.L. (2011). Speech Audibility Audiogram for Classroom Listening. From Building Skills for Success in the Fast-Paced Classroom. Page 132, Butte Publications, OR.
- Johnson, C.D. (2011). Functional Listening Evaluation. Based on Functional Listening Evaluation by C.D. Johnson & P. Von Almen, 1993. Educational Audiology Handbook. Singular, San Diego CA.
- Bodkin, K., Madell, J., & Rosenfeld, R. (1999). Word recognition in quiet and noise for normally developing children. Poster Session, American Academy of Audiology Convention, Miami, FL.
-
Anderson, K.L., Smaldino, J., & Spangler, C. (2012). Listening Inventory For Education – Revised. E-version of the LIFE-R,
https://successforkidswithhearingloss.com/tests/life-r . Available June 2012.
These are the views of Karen Anderson, PhD who reserves the right to adapt them as she learns more from the literature and the many DHH professionals and parents who are helping students deal with these issues everyday.
Original post May, 2012 (c) Karen L. Anderson, PhD, revised January 2014, August 2015